Financial data extraction is the work of turning a company's filed accounts into structured numbers a model, an analyst or a credit system can use. For listed companies that is getting easier, because more regulators now require machine-readable filings. For the millions of private companies that file with business registries, it still means reading PDFs, scanned images and local accounting formats. This guide explains how AI and OCR pipelines extract and standardise those accounts, where they fail, and how to judge the result, with dated, sourced figures throughout.
01Why Filed Accounts Are Still Hard to Use
Most of the world's companies are private, and for most private companies the only independent financial record is what they file with a business registry. That record is valuable precisely because it is filed under a legal obligation and dated. It is also hard to use at scale, because each registry decides what it publishes, in which format, and under which accounting framework.
The register is the source; the format is the problem
Take the UK, one of the most digitised registries. Companies House had 5.43 million companies on its register at 31 March 2025 and accepted 14.7 million filings in 2024–25, 91.5% of them digitally, according to its annual report for 2024 to 2025. Even there, a filing being "digital" does not guarantee its figures are tagged. In a February 2023 post, Companies House said more than 4 million sets of accounts are filed each year, and that over 65% of companies already used software filing as their preferred method. The rest arrive by other routes, including paper, and are published as images.
Why it matters for anyone using company financials
Extraction is not an end in itself. It is the step that lets a credit team spread a private buyer's accounts, lets a compliance team check whether a supplier's size matches its claims, and lets a transfer pricing analyst build a set of comparables. When the step is done by hand, it is slow. When it is done badly, the error carries into every decision made on that number. Our guide to company financial data providers compares where the figures come from in the first place.
02The Format Spectrum: From iXBRL to Handwritten Scans
Filed accounts reach a pipeline in very different states. The table below sets out the main formats, from the most machine-readable to the least, and what each one demands.
| Format | What it contains | Extraction method | Typical failure |
|---|---|---|---|
| iXBRL / XBRL | Human-readable report with each figure tagged to a taxonomy concept | Parse the tags directly | Company-specific extension tags, inconsistent period labels |
| Digital PDF | A text layer, but no tags | Text and layout extraction, then table reconstruction | Multi-column layouts, merged cells, notes split across pages |
| Scanned PDF | An image of a page | OCR, layout analysis, table reconstruction | Skewed pages, faint print, stamps over figures |
| Poor scans, handwriting | A low-quality image | OCR plus human review | Misread digits (1/7, 3/8), lost decimal separators |
| Not published | Nothing, or a balance sheet only | No extraction possible | Confidentiality options, abridged or micro-entity accounts |
Table 1. Filed-accounts formats and what each means for financial data extraction.
Regulators are moving filings towards tagged data
The direction of travel is clear: regulators are moving filings towards tagged, machine-readable formats. In the US, the SEC adopted Inline XBRL on 28 June 2018, phased in for fiscal periods ending on or after 15 June 2019 for large accelerated filers, 2020 for accelerated filers and 2021 for all others. In Europe, listed issuers report in the iXBRL-based European Single Electronic Format (ESEF); by May 2022, XBRL International's filings.xbrl.org repository held more than 3,400 ESEF filings. In the UK, the ICAEW reported in June 2026 that from April 2028 all companies will have to file accounts using commercial software, and small and micro companies will have to file a profit and loss account.
03How a Financial Data Extraction Pipeline Works
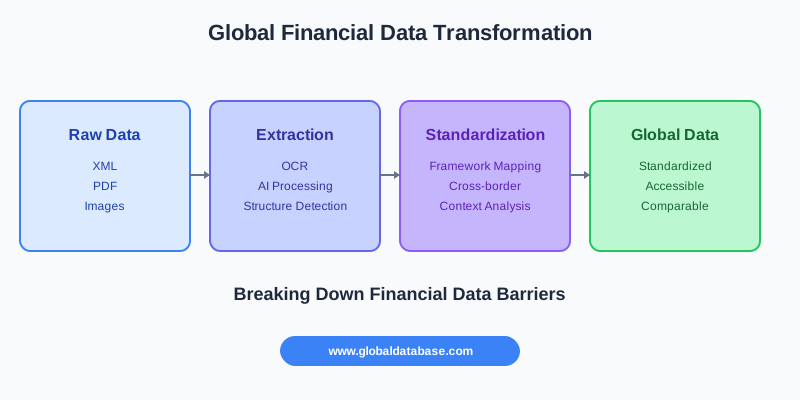
A production pipeline is not one OCR model. It is a sequence of steps, each with its own failure modes and its own checks. The diagram below shows the order most pipelines follow.
Parse what is already structured
When a filing is iXBRL, the right approach is to read the tags, not to OCR the rendered page. Each tagged fact carries a concept, a period, a unit and a value. The hard parts are company-specific extension elements, inconsistent period labelling and the taxonomy version the filer used. Extraction here is mostly a mapping problem.
OCR and layout analysis for PDFs and scans
For image-based filings, OCR converts pixels to characters, but financial statements are tables, and plain OCR output loses the table. Layout analysis has to recover which numbers sit in which row and column, which column is the current year and which the comparative, and which line is a subtotal. This is where generic document tools struggle, and where the term OCR financial statements covers a far harder problem than OCR on invoices.
AI for labels, notes and context
Machine learning models help most with the language around the numbers: recognising that a line labelled one way in a Dutch filing means the same as a differently worded line in a French one, spotting that a figure is stated in thousands, and finding the note that explains an exceptional item. Large language models can help with that mapping, but they should propose, not decide: every mapped value still has to pass the arithmetic checks described in section 6.
04Standardising IFRS, US GAAP and Local GAAP into One Taxonomy
Extraction gives you numbers. Standardisation makes them comparable. The IFRS Foundation maintains complete profiles for 170 jurisdictions describing how each uses IFRS Accounting Standards, and private companies in most countries report under national frameworks instead: FRS 102 in the UK, HGB in Germany, the Plan Comptable Général in France, Dutch GAAP in the Netherlands. The same economic item appears under different names, in different positions, and sometimes with different measurement rules.
What a good mapping keeps
Mapping should never throw the original away. A standard field is useful only if a reviewer can see the caption it came from, the page, the units as stated and the framework the company reported under. That is what lets an analyst decide whether a ratio is comparable across two companies or only looks it.
| Normalisation step | What changes | What must be kept |
|---|---|---|
| Units | Thousands or millions scaled to units | The stated unit (e.g. TEUR, £'000) |
| Currency | Optional conversion to a reporting currency | Original currency and the rate and date used |
| Period | Aligned to a fiscal year label | Actual period start and end dates, including short or long periods |
| Sign conventions | Costs and losses stored consistently | The sign as presented |
| Framework | Captions mapped to one taxonomy | The framework (IFRS, FRS 102, HGB, PCG) and the original caption |
| Derived ratios | Margins, liquidity, leverage computed | A label marking them as derived, not filed |
Table 2. Normalisation steps in financial statement standardisation, and the provenance each one should preserve.
05What Extraction Cannot Fix: Disclosure Gaps
The best pipeline can only extract what was filed. In many countries, small companies file little or nothing that shows performance.
Confidential, abridged and unfiled accounts
In France, micro-enterprises can opt to keep their annual accounts confidential, and small companies can ask that their income statement not be made public, under the Macron law of 6 August 2015, as summarised by Legifiscal. In the UK, small and micro companies have not had to file a profit and loss account; that changes from April 2028. In the US, private companies generally file no financial statements with any state registry at all, which our guide to US private company financials covers in detail.
When a company files only a balance sheet, the honest output is a record with no revenue field, not a modelled revenue figure dressed up as filed data. Modelled values have their uses, but they should be labelled as modelled everywhere they appear, so nobody prices a loan or a policy on a guess they thought was a filing.
06Accuracy at Scale: Let the Accounts Check Themselves
Data preparation is where analytical time goes. In Anaconda's 2022 State of Data Science report, a survey of 3,493 respondents in 133 countries, data preparation and cleansing took 38% of data scientists' time. Clean, validated financials remove much of that work downstream, but only if the validation is real.
Financial statements have a useful property: they contain their own checks. Assets must equal liabilities plus equity. Line items must sum to their subtotals. This year's comparative column should match last year's filing. A good pipeline uses these identities to catch extraction errors automatically, instead of relying on a vendor's accuracy percentage.
Why accuracy claims are hard to compare
Vendors quote accuracy figures measured in different ways: per character, per field, per document, on clean digital PDFs or on poor scans. A figure is only meaningful if you know what was measured and on which documents. The practical test is to ask for field-level results on a sample of your own target companies, and to see how many records failed validation and went to review.
07A Worked Example
A credit team needs three years of financials for "Nordwerk Maschinenbau GmbH", a private German supplier, and its UK subsidiary.
- Collect: the German filings are retrieved from the register as PDFs with a text layer; the oldest year is a scanned image. The UK subsidiary's accounts are iXBRL.
- Read: the UK accounts are parsed from their tags. The German PDFs go through text and layout extraction; the scanned year goes through OCR.
- Structure and map: HGB captions such as "Umsatzerlöse" and "Forderungen aus Lieferungen und Leistungen" are mapped to standard fields, with the original captions and page numbers kept. "Angaben in TEUR" sets the unit.
- Validate: the scanned year fails a subtotal check because a digit was misread. It goes to review, is corrected against the image and passes.
- Output: the team receives three comparable years in one schema, each figure traceable to a registry, a filing and a page, with derived ratios labelled as derived.
What used to take an analyst a morning of re-keying becomes a review of one flagged figure.
08Where Extracted Financial Data Gets Used
- Credit and financial statement spreading: lenders and trade credit teams need private-company balance sheets and P&Ls in a consistent layout to set limits. See business credit risk.
- Due diligence and KYB: filed turnover and headcount test whether a counterparty is the size it claims to be. See financial due diligence.
- Transfer pricing: benchmarking studies need comparable private companies with standardised margins. See transfer pricing.
- Investment screening and M&A: private targets are screened on filed figures rather than estimates.
- AI financial statement analysis: AI agents answering questions about companies need structured, sourced figures to cite, not PDFs to summarise. See company data for AI agents.
09How to Evaluate a Financial Data Extraction Provider
Six questions to ask, whether you build or buy
Whether you build a pipeline or buy the data, ask the same questions:
- Source: are financials extracted from the registry filing itself, or from a third-party dataset? Can you see the original document?
- Provenance: does every figure carry its registry, filing reference, filing date, page and original caption?
- Coverage by format: which jurisdictions are iXBRL, which PDF, which scanned, and how does accuracy differ between them?
- Validation: which accounting identities are checked, and what happens to records that fail?
- Filed vs. modelled: are estimates and derived ratios clearly separated from filed figures?
- History and delivery: how many years are available, and can you get it by API, bulk feed or inside the tools you already use?
Start from what registries actually publish
Our registry API access map shows which countries publish data in machine-readable form, a useful starting point for judging coverage claims.
Global Database sources company financials from filings across 400+ government registries in 200+ countries, covering 600M+ companies, with up to 20+ years of history where available. An OCR and AI pipeline extracts every line item, validates it against the document's own totals and maps it to one global taxonomy with derived ratios, so listed and private filings sit in the same schema. Every standardised figure carries its attribution: the registry, the filing and the date. For select jurisdictions the original filing is included alongside the digitised data, and where a company does not file, no estimate is substituted for a filing. Data is delivered through the REST API, an MCP server and bulk feeds in CSV, JSON or Parquet.
10Frequently Asked Questions
What is financial data extraction?
Financial data extraction is the process of turning financial documents, such as a company's filed annual accounts, into structured data. It covers reading the document (parsing XBRL tags or running OCR), rebuilding the tables, mapping each line item to a standard field and validating the result against the statement's own totals.
How does OCR extract data from financial statements?
OCR converts the image of a page into characters, but financial statements are tables, so OCR alone is not enough. Layout analysis has to rebuild rows and columns, identify the current and comparative years, detect units such as thousands, and separate line items from subtotals before the numbers can be used.
What is the difference between iXBRL and a PDF filing?
An iXBRL (Inline XBRL) filing is a human-readable report in which each figure is tagged with a taxonomy concept, period and unit, so software can read the values directly. A PDF has no tags: a digital PDF has a text layer, while a scanned PDF is only an image and needs OCR.
Can AI extract data from scanned or handwritten accounts?
Yes, but with more errors than on digital documents. Poor scans and handwriting cause misread digits and lost decimal separators. The safeguard is validation: checking that assets equal liabilities plus equity and that line items sum to subtotals, and sending anything that fails to human review.
How are IFRS, US GAAP and local GAAP figures made comparable?
Each local caption is mapped to a field in one standard taxonomy, and units, currency, periods and sign conventions are normalised. A good process keeps the original caption, page and framework alongside the standard field, because some measurement differences between frameworks remain and should be visible to the analyst.
What is financial statement spreading?
Financial statement spreading is the credit-analysis practice of entering a borrower's or buyer's financial statements into a standard template so they can be compared over time and against other companies. Automated financial data extraction feeds spreading by delivering the statements already structured and standardised.
Why are some private company financials missing even after extraction?
Because they were never filed. Many countries let small companies file abridged accounts or keep their profit and loss account confidential, and US private companies generally file no financial statements with state registries. Extraction can only work on what the registry publishes.
How accurate is automated financial data extraction?
It depends on the format. Values parsed from iXBRL tags reflect exactly what the filer tagged, while OCR on poor scans is less reliable. Vendor accuracy figures are measured in different ways, so the most useful test is field-level results on a sample of your own target companies, plus the share of records that failed validation.