What is data
Before we hop into data processing and analyzing, let’s make sure that we are on the same page in understanding what raw data actually is.
Generally speaking, data is the registered set of events, numbers, observations, words, reactions or anything alike. Often, data and information are used interchangeably. Most of the times this is not wrong, however there is a small difference. Information does not always take the form of data, and does not all the time come in a quantifiable format. Therefore, information might have to be transformed in a way that would be compatible with future processing. Examples could be news, images, descriptions and any other information that can be perceived or understood by people, but not by machines (that have not been trained to read these types of files beforehand). Information of this kind is called as well raw data in many sources.
Consequently, the results obtained after the data is processed and analysed are considered information - taking the form of the driven conclusions.
Raw Data Definition
Also known as primary data, atomic data, uncooked data or source data, raw data is the accumulated information that has not been processed in any way for further use.
Types of Raw Data Out There
As it was already mentioned, there is data that can be read only by people, and data that can be perceived by machines. Human-readable data is considered to be unstructured, or needing some type of processing in order to help a program to analyse it. It may require understanding, generalizing, logic or other human actions. There are tools that are able to recognize and understand images or written text today. However the access to that kind of tools is yet limited, requires algorithms and machine learning, and is oftentimes expensive. Therefore, human resources are still required to make use of this kind of data.
Machine-readable data is structured so that a program could read it. However it still remains to be raw data as long as it has not yet been processed in any way to identify trends or derive conclusions. Machine-readable raw data can regard a wide range of underlying types of information. For example, a hospital collects data about your healthcare history, your age, height and weight, your address, even about your relatives and more. Similarly, other personal data such as email address, location, phone number, preferences and other are required to submit when you register on a social media platform or in exchange for a white book or article you might want to read online.

Transactional information is the information about transactions people make either online or offline. In the case of offline transactions, it is harder to get information about the consumer him/herself. Online transactions allow to follow and further analyse the behavior of each customer separately. This does not only include the stats on how many and how often purchases are made, but also credit card information and other facts about the buyer.
Sensor data are collected by various types of devices as a result of detecting and registering some type of input, ranging from temperature and humidity in a certain area, to vital body functions monitored and recorded by an individual’s smartwatch.
Web data refers to all types of information that one can collect online, regardless of the purpose. It might be the result of a soccer game, a company address and its characteristics, the number of followers of a certain influencer and any other publicly available information.
Big Data Definition
Whichever type or types of data you might need to use, knowing what item a single customer bought or when he or she bought it will not give you an idea about the local market, or demand for that given product. To be able to derive conclusions, you will need to accumulate records for an extended period of time, or for thousands or hundreds of thousands of individuals or transactions. This is how separate records become big data.
Most commonly, big data refers to large and very large sets of data. Big data may still be raw data, as long as it is unstructured and no modifications are applied to it. Not all available software have the capacity to process it. With the increasing amount of information available, continuous improvements are implemented to make use of as much data as possible, to allow data mining, and to ease the experience of users with these software programs.
Many marketers and other data users face more troubles, than just getting to analyze data in an accurate way and derive objective data driven conclusions. As per December 2018, one of the biggest problems faced by data users is the outdated information comprised in the data sets applied in researches, leading to erroneous conclusions and thereupon based decisions. The chart below, according to MarketingCharts, shows the biggest challenges regarding the quality of data used.
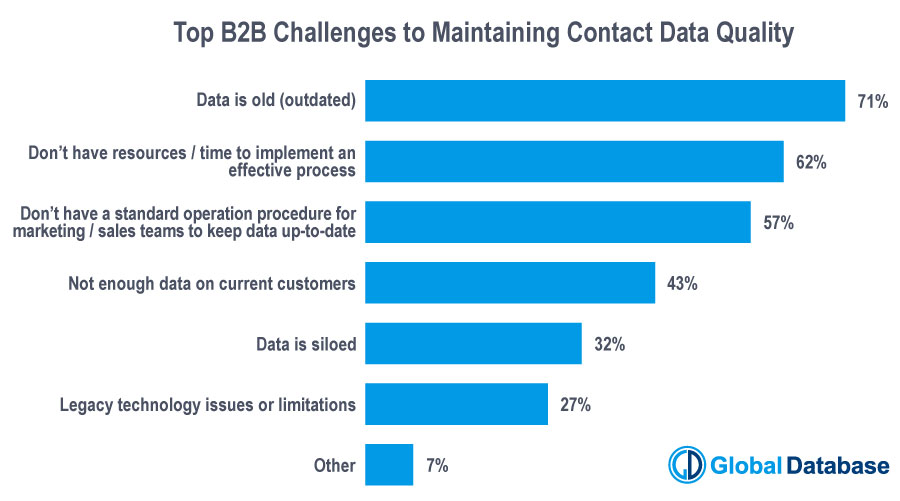
71% of respondents claim that the data sets they use are outdated or low quality ones, while 57% face the challenge of lack of time for the maintenance of existing data sets. Well, it is up to every company separately to estimate the impact of low quality or outdated information on the overall marketing and, especially, business performance. Saving resources on collecting up-to-date figures and emails, and spending large shares of marketing budgets on contacting people who do not correspond to the real needs of the business and marketing campaigns will only result in expenses that will never be redeemed.
To subscribe or not to subscribe, that’s the question
According to CMO Council, the main impediment to starting the use of data-driven customer strategies was an inadequate budget. When the question comes to the worthiness of subscribing to company intelligence platform products, it is not the costs of subscription to be considered, but the opportunity costs.
Objectively estimating your pros and cons and understanding the true value of a business intelligence platform for a company and its future in this competitive world, you might be very likely to decide that this kind of subscription would be really helpful. We made a research and compiled its results regarding the companies offering business intelligence products, and for every type of goal and activity there are both advantages and disadvantages. It is up for every customer to decide what is best for his/her business, however we’d like to emphasize the importance of results obtained by users, and the frequency of data refreshments. For example, Global Database performs daily verification of companies data, and the email addresses listed are validated once a month, allowing users to rejoice at some of the highest deliverability rates and truly the most recent available data.
Processing raw data
Before becoming able to get the sought for insights and even analysis, raw data will need some processing. It varies, however, depending on your goal. As there is an enormous amount of possible goals you might be following, we wouldn’t be able to present them all in a single article. Hence, we’ll generalize the process, and briefly describe the steps as follows.
1. Set the goal / goals
If you are looking for something, you must know what and why you are looking for, and what you are going to do with what you will find. Otherwise you’d just be browsing around, with no goal and no particular direction. The goal of the whole process will always depend on a variety of things, such as: is the underlying data expected to confirm or disprove some previously known information? what should the result look like? who will be the user of the obtained insights? how will the insights affect your or the company’s activity? what would be the insights that would define success and which ones would define failure? - and many other details that would help to better structure the whole process of uncovering the insights.
When you know where to start, what path to follow and where to go, the whole process becomes smoother. According to a study by Forbes, 82% of the people who planned their actions using a vision board, reported to have achieved more than half of listed goals.
2. Configure data streams, if multiple, and collect the data
When you have figured out what exactly you are going to do, configuring your data streams for a smart data collection becomes key. Your data source can vary from publicly available data, to that pulled from specific data lakes or data warehouses, to data provided by business intelligence platforms (e.g. Global Database), and to data collected from your Google Analytics or social media account. Obviously, you can use a combination of these and other data sources, whichever would help you get to the insights you are looking for.
3. Adjust the inputs (pre-processing)
This stage mostly implies data munging, also known as data wrangling. This is the preparation of the processing stage, given by reformatting raw data by means of transformation and mapping. Usually, this is done with the goal of bringing its format to a more suitable one for machine learning.
Machine learning for marketing can be applied for various purposes. Some example would be examining historical engagement with your customers with the purpose of understanding the factors influencing their propensity to convert; assessing the market sentiment; simplifying ad targeting and customer experience personalization; and lead scoring to name just a few.
4. Processing (transformation)
As in the previous stage data was adjusted for further use, here it is technically processed. This means that it is adjusted for and connected to business intelligence tools, or machine learning and AI algorithms are applied. Processing brings data closer to the goals set initially (collection of instructions), hence data is manipulated in a way that would correspond to its intended use (execution of instructions).
According to yet another Forbes study, more than 80% of marketing companies implemented or expanded the usage of AI and machine learning in their activity, while about 75% of companies that use AI and machine learning have managed to grow their customer satisfaction by 10%.
5. Interpretation
By this time, the data is ready to be analyzed and interpreted for its user, who may either be you or another stockholder. Here various methods are applied, e.g. statistical, and results are most usually represented as different visuals to ease the identification of trends or other interesting facts and patterns. The complexity of this stage changes from case to case. Sometimes simple charts are enough to derive conclusions, while some other times machine learning needs to be applied.
If no other manipulation of data is needed, interpretation is presented in the form of a report, which can be graphical, animated, video, documented or any combination of these, compiling meaningful information to be presented to the interested person.
6. Modeling and validation (if it is the case)
Modeling is applied when there is a need for a thorough analysis and understanding of the data at hand, and types of models and ways of their application vary according to the type of outcome you need to achieve, what hypothesis you need to validate, or upcoming changes you need to forecast. For example, clustering techniques may be used to explore data. A short-term trend forecast or quantitative prediction may be required for upcoming strategy formulation. A qualitative classification of your targets might be what you are looking for, or any other type of techniques which most of the times have to explain and confirm a hypothesis you set. The most important aspect here is to estimate the degree to which predictions actually correspond to the observed data.
7. Decision making
Arguably the most important step of the whole process of turning raw data into insights, decision making is the stage where conclusions are derived and further steps are decided on. Of course, it strongly depends on the quality of the analysis and validation. If the results obtained there are misinterpreted, decisions might unfortunately lead to mistakes in future actions and cause many successful campaigns and ideas to failure.

Valuable marketing insights
If the steps of processing raw data into insights was as close to perfect as possible, be sure that your data-driven decisions will be more than valuable. Below, we list some tips that would help you to get the most out of raw data for your marketing insights:
Ignore noise. Make sure you concentrate on the pieces of information that are the most relevant to the goal of your research. Having said that, we’d also emphasize that it’s important to see an image as large as possible about your research subject and goal. In other words, you should not chase all rabbits, nor concentrate on one single chart, while losing a more general perspective of the situation.
Keep data as organized as possible and monitor it correspondingly. With a certain structure, you’d easier notice changes and errors, and will be able to apply relevant corrections in time and avoid further erroneous conclusions.
Be skeptical and realistic. Hopes and positive thinking are good, however when it comes to decisions, make sure they are fully data-driven. When using simple forecasting tools go for the least advantageous outlook. This does not mean that you should not aim at the most positive outcomes. Make hypotheses and test them all, it is easier now with machine learning.
Prefer dynamic over static. Data points may give you some information, but they will never give you an overall image. No matter what type of data you are using, if applicable look for patterns or trends.
Search for relationships. Some of these are obvious, others are hidden, others show up in time, when patterns and trends start shaping out. Many times cause-effect relations prove to be valid in situations when you’d never consider them, thus unveiling new unexpected insights.
Follow engagement. It may be wrong to consider that engagement is something to be followed by B2C companies only, and just on social media. Even if B2B companies engage in a slightly different way, you are still on to getting powerful insights to consider.
Personalize. Again, considering that personalization of your marketing campaigns are good only for B2C will result in missing opportunities for B2B companies. Various recent researches and surveys have shown that personalized content, including emails, are much more likely to deliver conversions, that the one that is not. Moreover, defining and targeting the companies for which your offer will bring the most value, and letting them know that you are aware of what they need or might need will trigger better results, than simply promoting what you have on tap.
Based on these and other tips, which are applicable to your activity, efficient marketing strategies may be formulated, as long as accurate data stays at the basics. The chart below based on a research by Ascend2 and Research Partners shows that data-driven marketing insights are on the rise in the recent years.
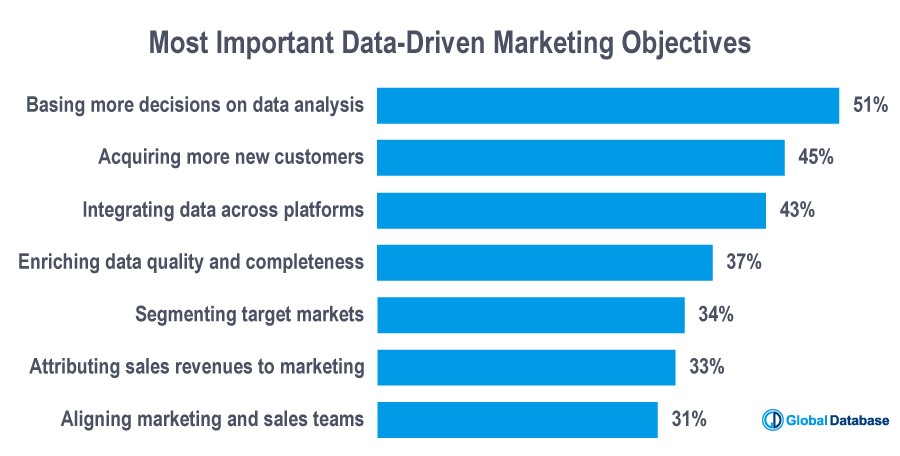
As can be noticed, more than half of respondents have appreciated the value of setting objectives based on data, and are planning to expand that practice for their businesses.
High-quality company data sources
The chart below shows the results of a research ran by Dun & Bradstreet on the technologies used by marketers in the marketing stack.
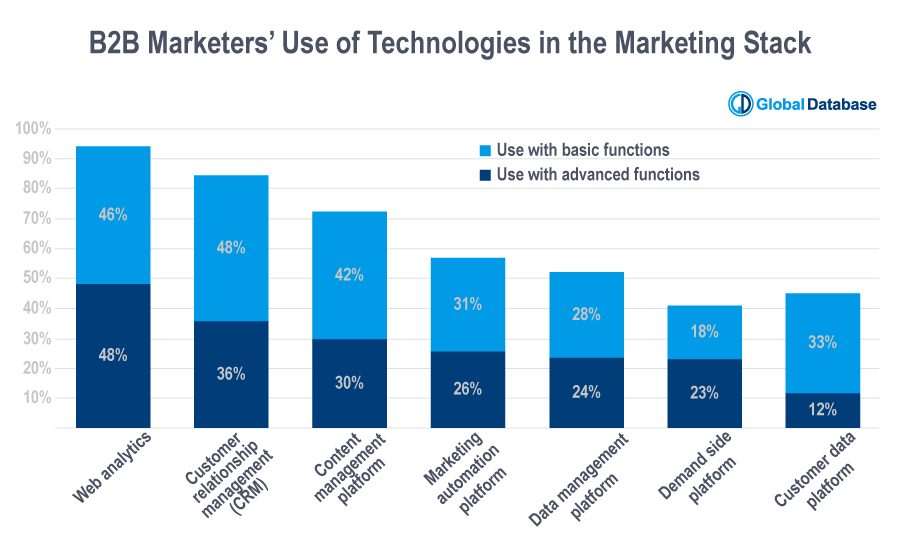
45% of the respondents, however, use information provided by customer data platforms, of which 73% (or 33% of the total initial number of respondents) report use with basic functions, and 27% (or 12% of the total initial number of respondents) report use with advanced functions. Today, there is number of business intelligence platforms available on the market. Several of them are leading this particular market, providing comprehensive company databases (e.g. Global Database, Zoominfo, Insideview and others). Hence, marketers get the option to acquire large volumes of data for the achievement of short-term and long-term marketing objectives.
When choosing your data provider, though, you should consider all the benefits you can gain with this or that company. Earlier we’ve argued the importance of the relevance and freshness of the data provided, but it never stops there. Functionality and types of data provided are paramount for gaining upon the use of business databases.
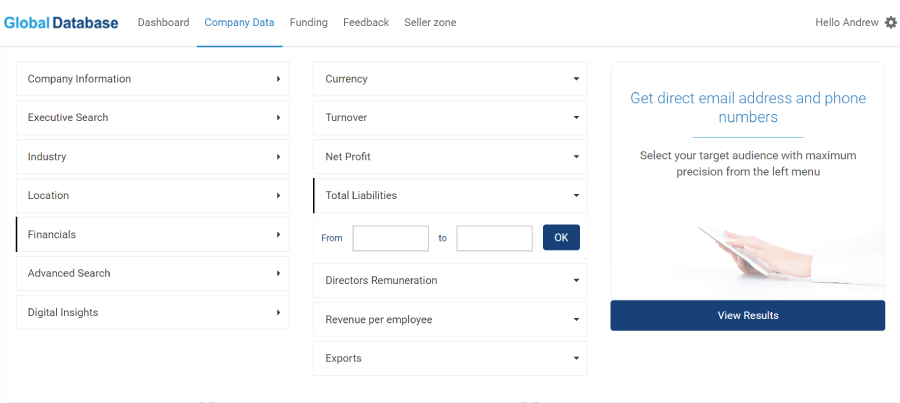
Along with the enhancement of the quality of data provided, we at Global Database are continuously working on the improvement of our users’ experience and of the functionality of our platform. In this sense, we offer a series of filters, that can be applied individually or cumulatively, so that you could easily segment the companies by their location, industry, financials, technology insights, and other criteria.
To sum up…
With all the data available from various sources marketers can use today, pulling the right raw data and making the most out of it can be challenging. The steps we’ve presented in this article are not set in stone, and every business should adjust the process of turning raw data into valuable marketing insights to their own needs and capacities. Having a plan of doing so, however, with all the steps clearly formulated and set, help the task to become easier and never seem unachievable again.
Our main advise would be to choose thoroughly the sources of raw data, tailor a combination of those to your needs, and get a clear view of the path to follow towards a great marketing performance